API Analytics
1. Overview
The API Analytics dashboard helps teams understand how APIs are being used and how they are performing across applications, API catalogs, and endpoints. It brings traffic, latency, reliability, and error data into a single view so you can quickly spot trends, investigate issues, and export results for reporting.
Data refreshes every five minutes.
1.1 What You Can Do
In API Analytics, you can:
- Monitor API traffic.
- Review latency trends.
- Analyze application performance.
- Track success and error rates.
- Compare usage across apps, API catalogs, and endpoints.
- Export the current dashboard view to an XLSX report.
2. Access and Prerequisites
To use API Analytics, you must:
- Sign in to the Developer Console.
- Have permission to view applications.
- Belong to an organization that has analytics data available.
All analytics shown in the dashboard are scoped to the current organization. If no analytics records exist for that organization, charts and tables may appear empty.
2.1 Opening the Dashboard
- Sign in to the Developer Console.
- Select API Analytics.
- The dashboard loads analytics for your organization.
3. Using Filters
Filters determine which resources and metrics are displayed in the dashboard. They are the primary way to narrow the view for investigation, comparison, or reporting.
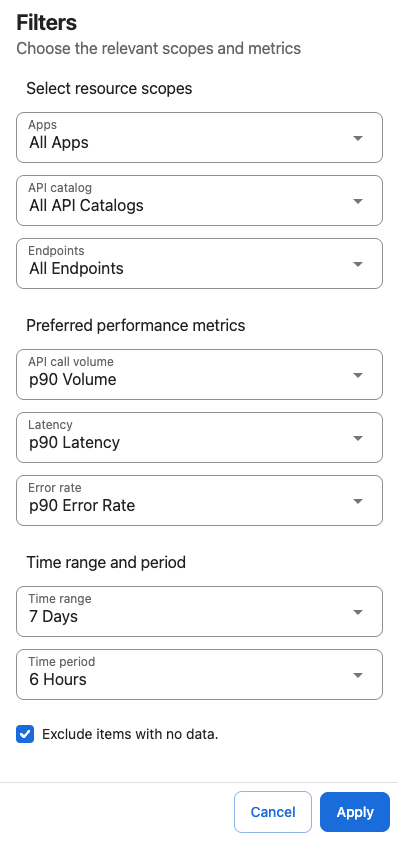
The Filters drawer includes the following groups:
| Filter group | Description |
|---|---|
| Apps | Filter by all apps or selected applications. |
| API catalog | Filter by all API catalogs or selected API catalogs. |
| Endpoints | Filter by all endpoints or selected endpoints. |
| Preferred performance metrics | Choose the metric representation used in the dashboard, such as API call volume, latency, and error rate. In the interface, these may appear as percentile-based options such as p90 Volume, p90 Latency, and p90 Error Rate. |
| Time range and period | Choose the reporting window and granularity, such as Today, Last 24 Hours, 7 Days, or 30 Days, plus a period such as 6 Hours. |
| Exclude items with no data | Removes resources that have no matching analytics in the selected scope. |
3.1 Applying Filters
- Open Filters.
- Select the required scope, metrics, and time settings.
- Click Apply.
To discard changes, click Cancel.
Start broad with all apps, catalogs, and endpoints. Then narrow one dimension at a time to isolate performance issues or high-error resources more quickly.
4. Dashboard Summary and Charts
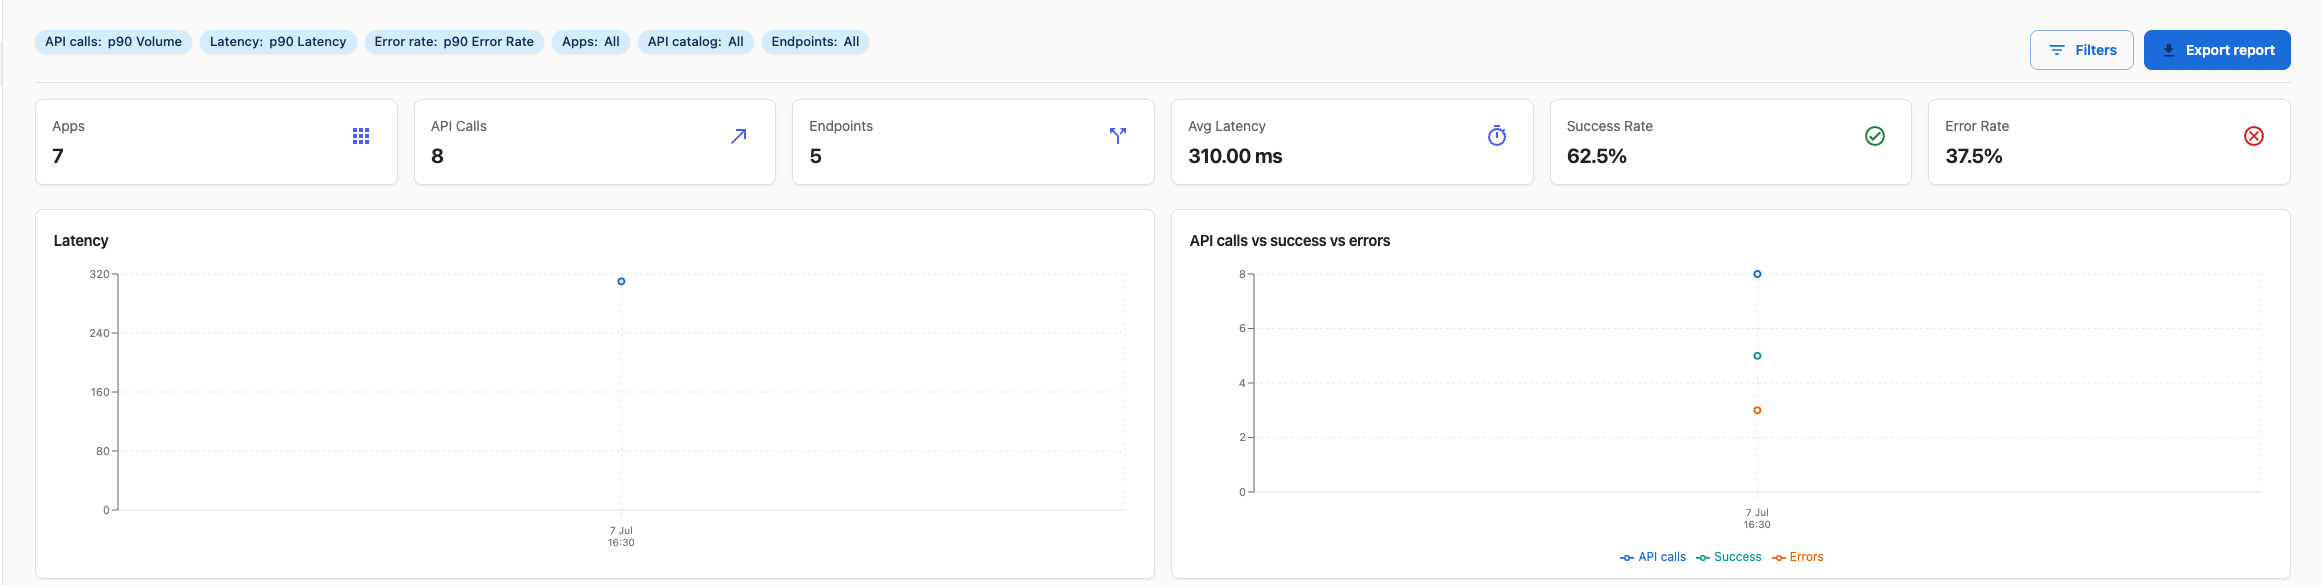
The top of the dashboard provides a summary of key indicators and trend charts for the currently selected filters.
4.1 Summary Cards
| Card | Description |
|---|---|
| Apps | Number of applications in scope. |
| API Calls | Total API requests in the current view. |
| Endpoints | Number of endpoints in scope. |
| Avg Latency | Average response time. |
| Success Rate | Percentage of successful requests. |
| Error Rate | Percentage of failed requests. |
4.2 Trend Charts
Latency Trend shows how response time changes over the selected period. Use it to identify sustained degradation, spikes, or recovery patterns.
API Calls vs Success vs Errors compares total traffic against successful and failed calls. This view is useful for identifying:
- Traffic increases or drops.
- Error spikes.
- Possible service disruptions.
- Periods where traffic is stable, but failures increase.
5. Distribution Views, Tables, and Highlights
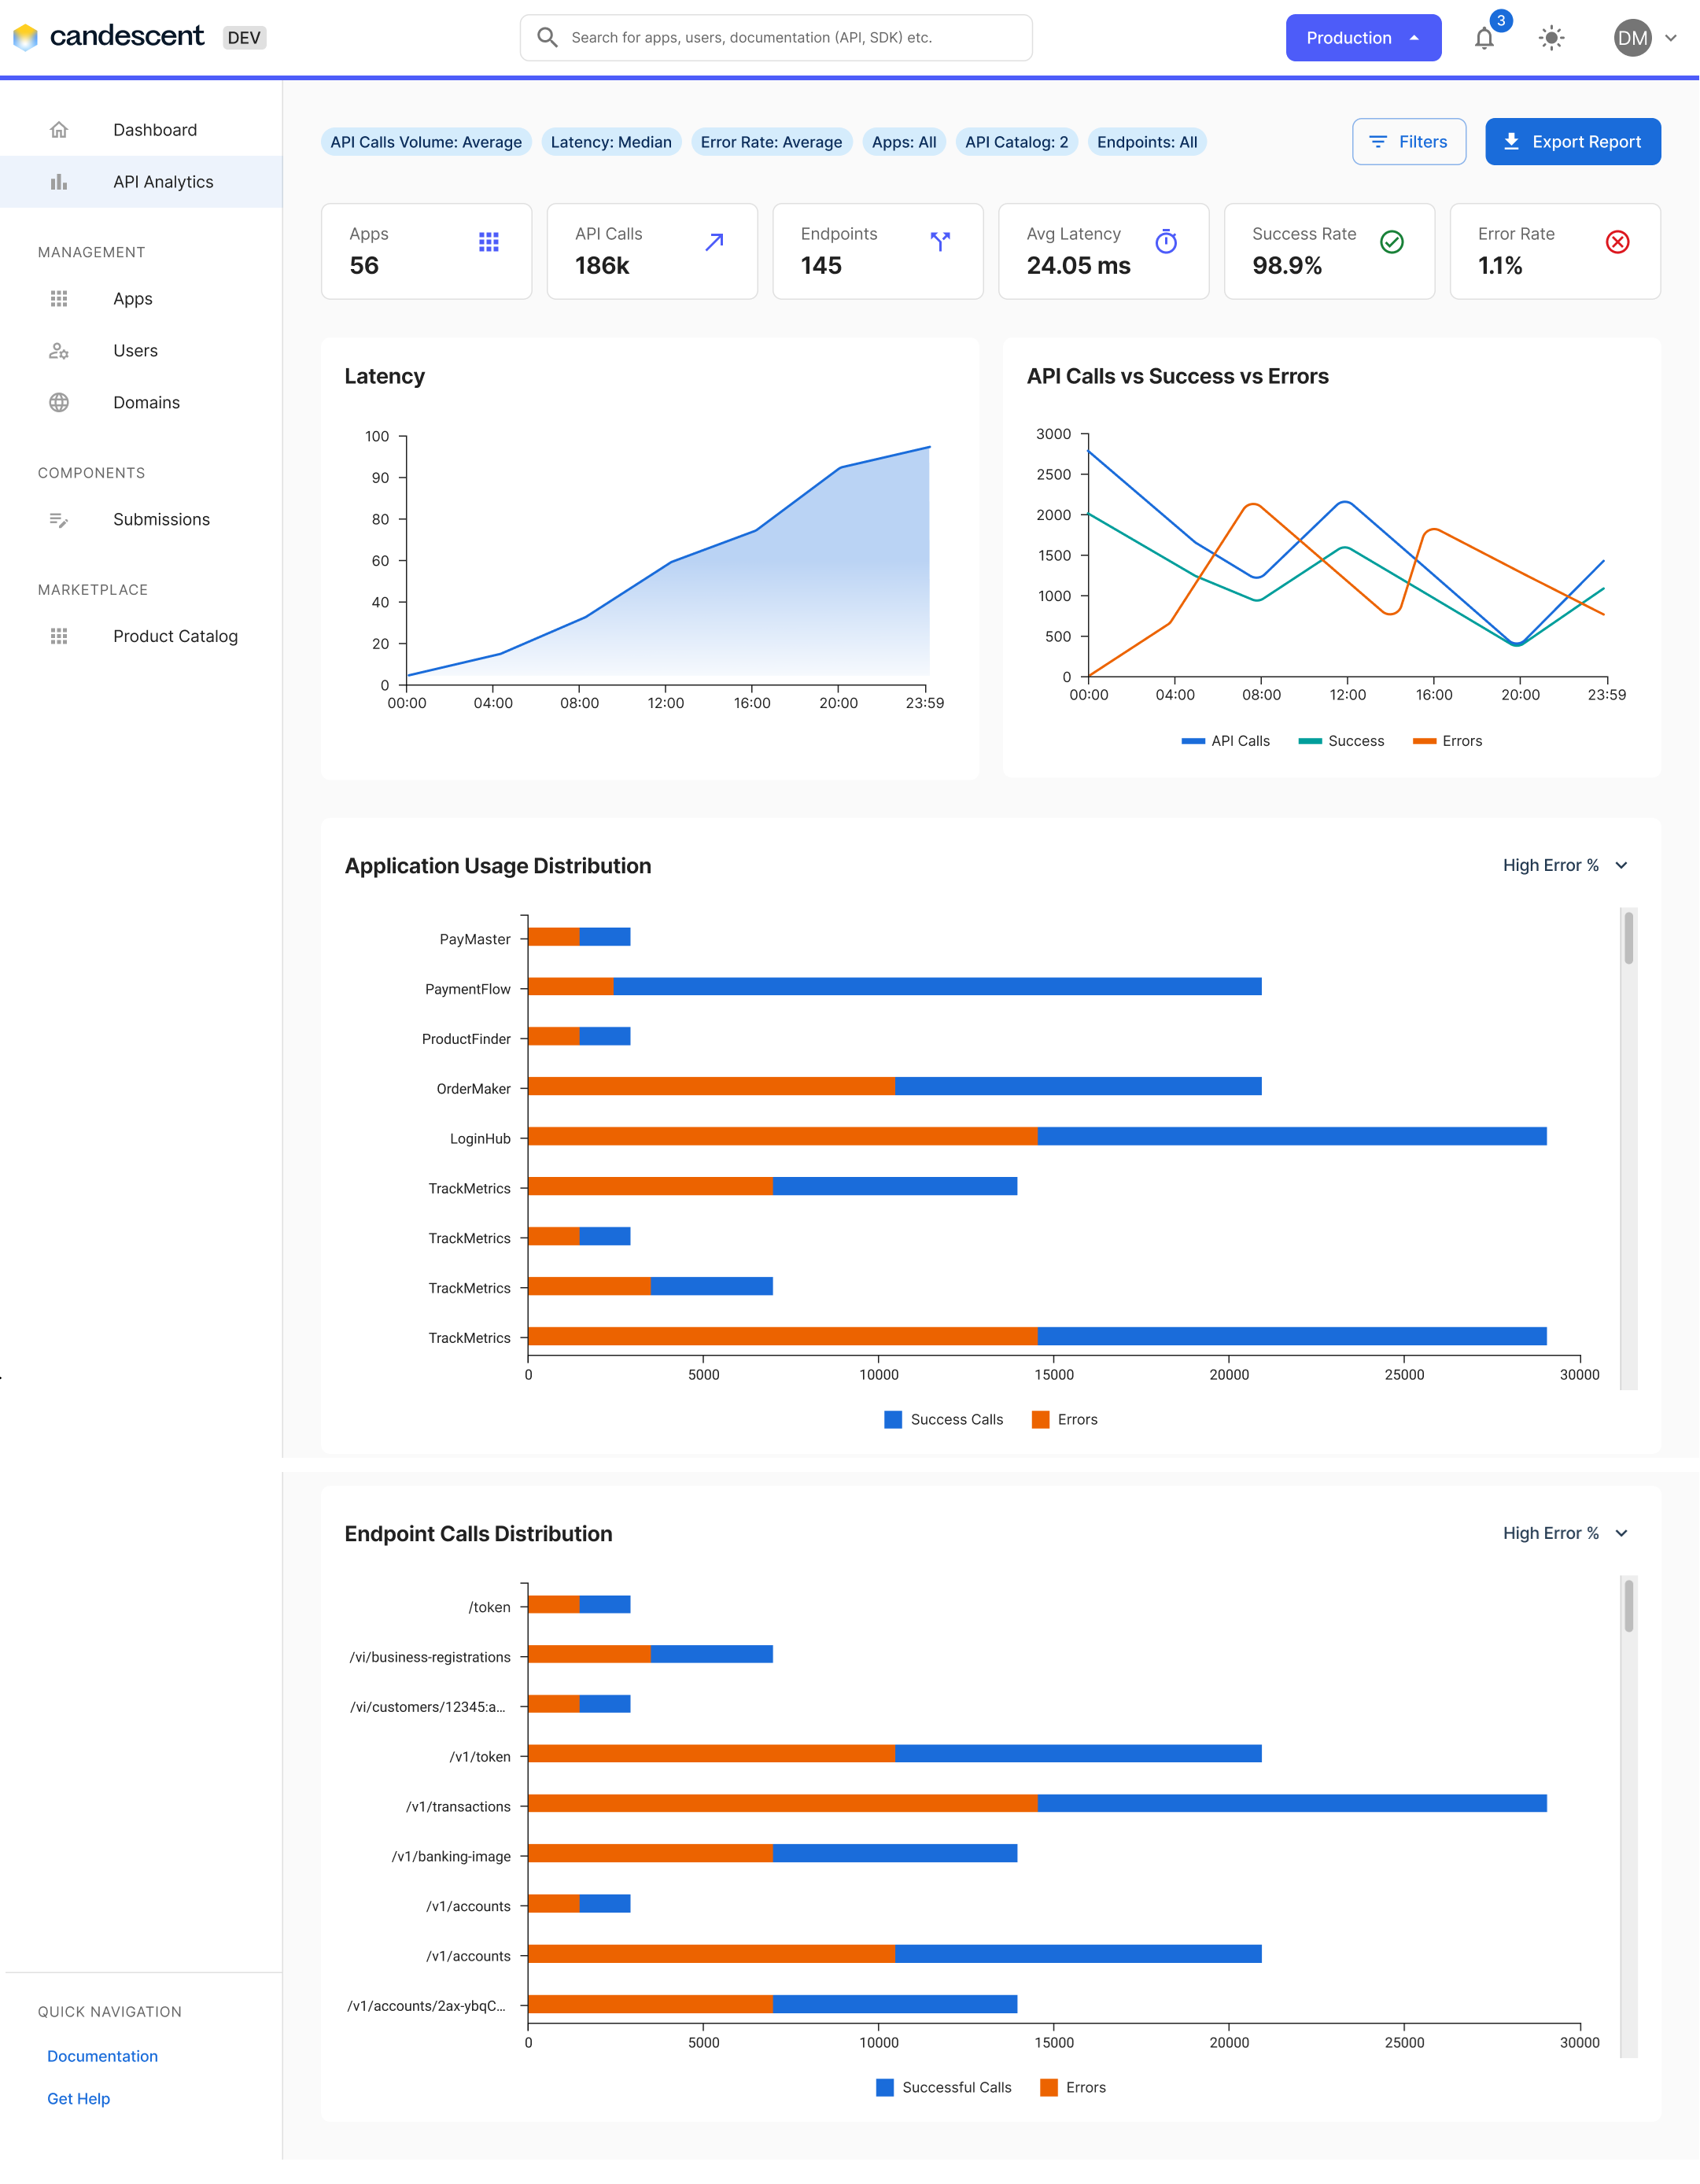
The dashboard also breaks performance down by application, API catalog, and endpoint so you can move from a high-level trend to a specific source of issues.
5.1 Distribution Charts
| Chart | Description |
|---|---|
| Application Usage Distribution | Displays successful and failed calls for each application. Hover over a bar to view the application name, successful calls, and error count. |
| API Catalog Distribution | Shows successful and failed requests for each API catalog. |
| Endpoint Distribution | Shows successful and failed requests for each endpoint. |
Use the following sort options to quickly surface the least reliable resources, validate the healthiest ones, or identify the busiest resources in the selected scope:
- High Error %
- Low Error %
- Total Calls
5.2 Performance Tables
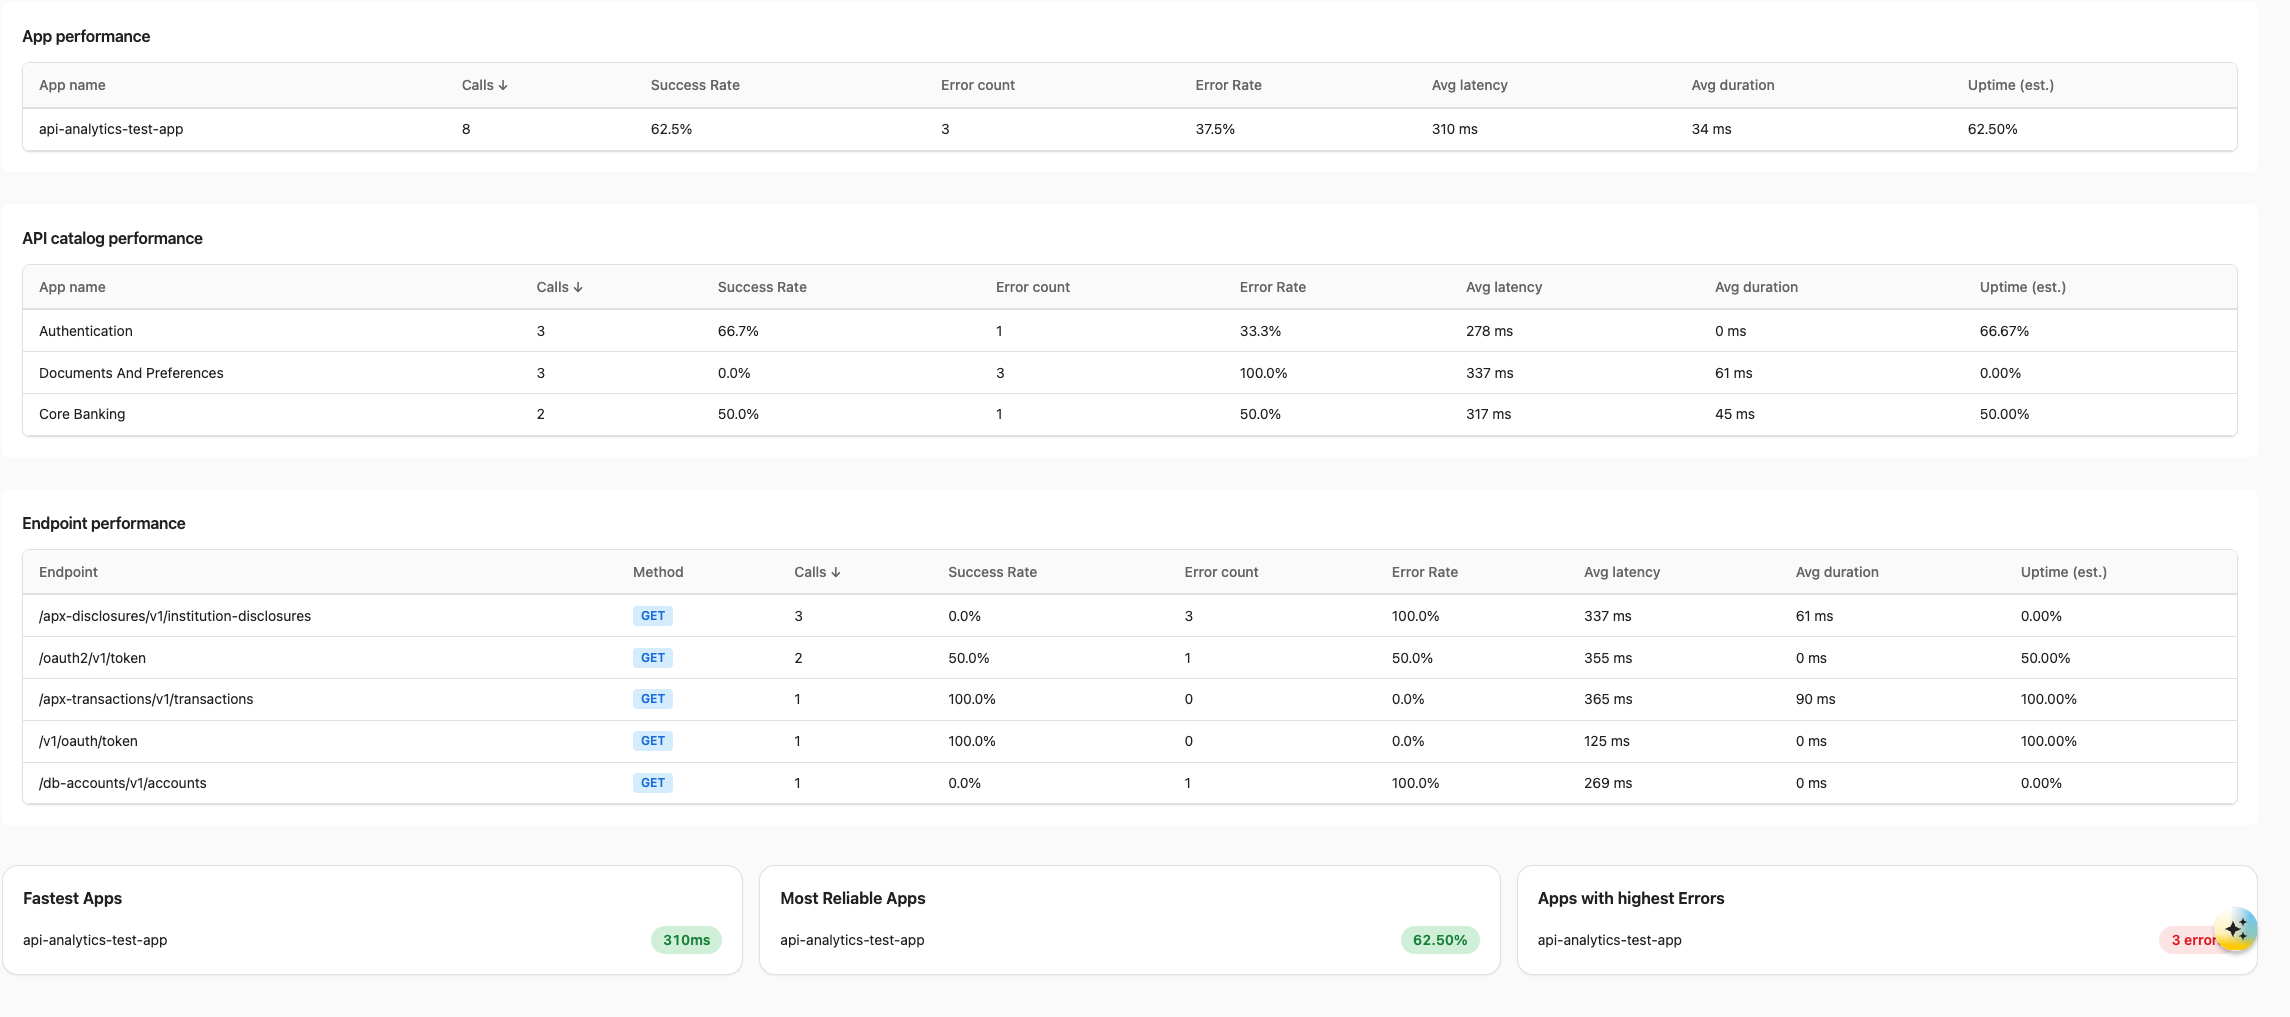
Detailed analytics tables provide a sortable reference view for operational review.
| Table | Description |
|---|---|
| App Performance | Calls, success rate, error count or error rate, latency, average duration, and estimated uptime by application. |
| API Catalog Performance | The same core metrics by API catalog. |
| Endpoint Performance | The same core metrics by endpoint (includes HTTP method where available). |
You can sort table columns by:
- Calls
- Success Rate
- Error Rate
- Latency
- Uptime
5.3 Performance Highlights
Highlight cards summarize the most notable items in the current dashboard view:
| Highlight | Description |
|---|---|
| Fastest Apps | Applications with the lowest average latency. |
| Most Reliable Apps | Applications with the highest success rate. |
| Apps with Highest Errors | Applications with the highest error counts. |
To use this section effectively, start with highlight cards to find outliers, confirm details in the tables, and then use the distribution charts to understand whether the issue is isolated to one app, catalog, or endpoint.
6. Exporting Reports
To export analytics data:
- Apply the required filters.
- Review the dashboard data to confirm the scope.
- Click Export report.
The exported report contains data for the currently selected filters.
- Export format is XLSX.
- Only currently loaded data is exported.
- Export is unavailable when no data exists.
7. Troubleshooting
| Issue | What it means | What to try |
|---|---|---|
| No analytics data available | No records match the current organization, filters, or time selection. | Verify the selected filters. Expand the time range. Confirm API traffic exists. |
| Dashboard not loading | The page did not fully load data or the session may be interrupted. | Refresh the page. Verify internet connectivity. Sign in again. |
| Export not available | There is no exportable dataset in the current view. | Wait for analytics to finish loading. Verify traffic exists. Adjust filters to include data. |
8. Quick Reference
| Action | Navigation |
|---|---|
| Open Filters | API Analytics → Filters |
| View Latency | API Analytics → Latency Trend |
| View App Distribution | API Analytics → Application Usage Distribution |
| View API Catalog Distribution | API Analytics → API Catalog Distribution |
| View Endpoint Distribution | API Analytics → Endpoint Distribution |
| Export Report | API Analytics → Export Report |
9. Frequently Asked Questions
9.1 What data does the dashboard show?
The dashboard shows API consumption and performance data for the current organization, based on the selected filters and available analytics records.
9.2 Does export include the whole organization history?
No. Export only includes the data currently loaded for the selected filters and time settings.
9.3 Why do some apps, catalogs, or endpoints disappear after filtering?
If filters are narrowed or Exclude items with no data is enabled, resources without matching analytics are removed from the current view.
Next Steps
For additional help, visit Troubleshooting and Support.